
Relates to all versions
Location
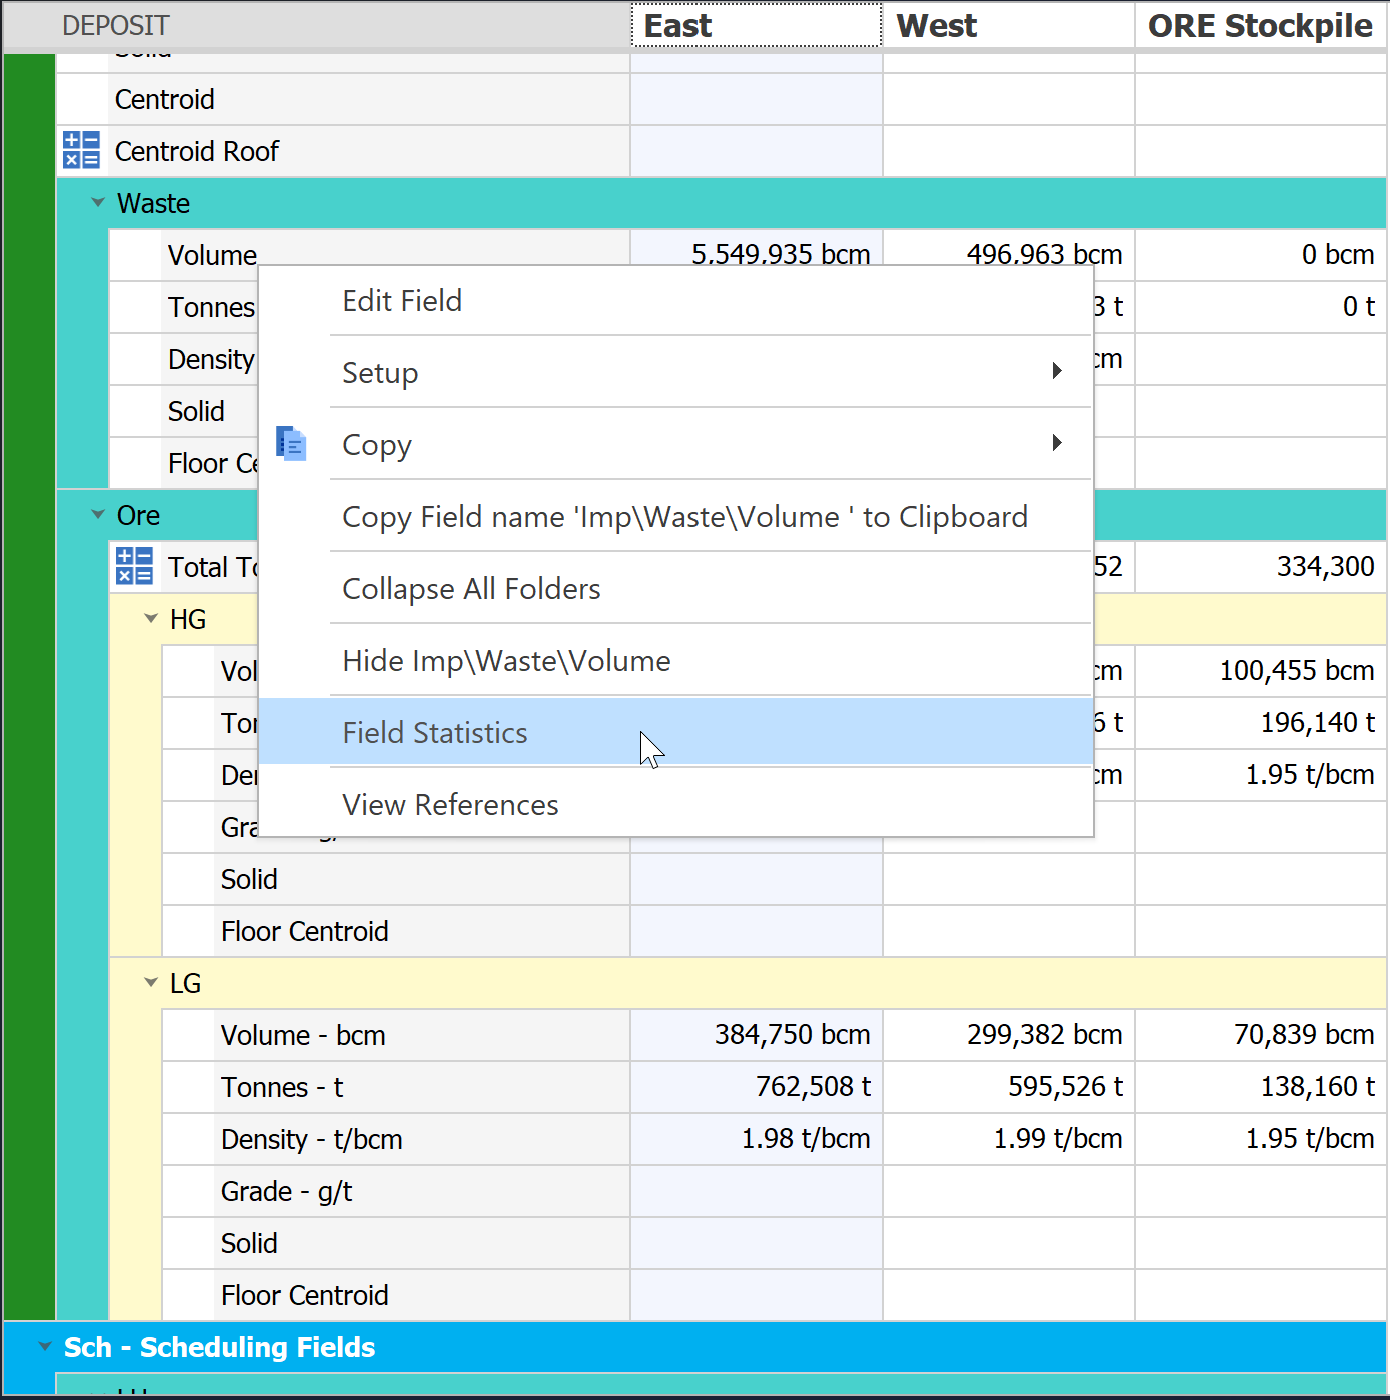
In order to access Field Statistics, right click the Field within the Data Grid and click the Field
Statistics option
Summary
Data Table Statistics is a feature of Spry that allows a Field to be viewed and summarized as a
number of Graphs, Statistics and Details.
The Data Table Statistics can help when troubleshooting as well as verifying the Data Import
worked correctly.
User Interface
UI: Table Statistics
A. Statistics Options
B. Fields Tree List
C. Field Statistics
Statistics Options
These options can vary depending on which Field Type is selected in the
Fields Tree List found below the Statistics Options
Number / Percentage Type Options
Range: Allows the use of a Range Select Container to change the Data that is visible in the Field Statistics
Include Zeros: This option will allow the value of zero (0) to be displayed in the Field Statistics. Without this option enabled, zeros will be filtered out.
Interval: Allows the customization of the Interval that the graph will increment by. This is automatically but can be edited in order to gain / lose detail in the graph.
Minimum: Allows the minimum value in the bar graph to be set. Any values below this will not be represented in the graph. This is automatically set when the graph is generated.
Maximum: Allows the maximum value in the bar graph to be set. Any values above this will not be represented in the graph. This is automatically set when the graph is generated.
String Type Options
Range: Allows the use of a Range Select Container to change the Data that is visible in the Field Statistics.
Include Empty Strings: Allows empty strings to be represented in the graph.
Boolean / Solid Type Options
Range: Allows the use of a Range Select Container to change the Data that is visible in the Field Statistics.
Date / Time Type Options
Range: Allows the use of a Range Select Container to change the Data that is visible in the Field Statistics.
Include Null Values: This option will allow empty nodes to be displayed in the Field Statistics. Without this option enabled, they will be filtered out.
Interval Type: Allows the interval to be set to commonly used interval.
Custom Interval: Allows the interval to be set to a custom time frame.
Start: Allows the start date to be edited. This is automatically set when the graph is generated.
End: Allows the end date to be edited. This is automatically set when the graph is edited.
Fields Tree List
This Tree List contains all the Fields currently in the Data Table. Selecting a different Field
gives the user access to different options, graphs and statistics about that individual Field.
Field Statistics
A. Field Statistics & Details
B. Statistics Summary
Want to learn more?
Click here to login to our Learning Management System
Click here to request access
Comments
0 comments
Please sign in to leave a comment.